Stackdriver Diagnostics Tools with Sharat Shroff and Morgan McLean
Sharat Shroff and Morgan McLean, Product Managers at Google Cloud, cover with your cohosts Francesc and Mark some of the Stackdriver tools at your disposal when you’re investigating an issue on your application.
About Sharat
Sharat is a product manager working on developer infrastructure for Google Cloud. He works on application monitoring and diagnostics.
About Morgan
Morgan is the product manager for Stackdriver Trace, and has spent much of his career working on web services and web frameworks prior to his recent arrival at Google. Morgan works out of the Kirkland, Washington office, and enjoys mountain biking and hiking in his free time.
Cool thing of the week
- Adventures in SRE-land: Welcome to Google Mission Control blog post
- Inside Google’s Cloud solutions with Miles Ward | The Apps Show YouTube
Interview
- Stackdriver docs
- Stackdriver Error Reporting docs
- Stackdriver Trace docs
- Stackdriver Debugger docs
- Stackdriver Logging docs
- Cloud Source Repositories docs
- Installing the Stackdriver Monitoring Agent (for GCE and AWS) docs
- Stackdriver Trace Analysis Reports docs
- GCPNext: Spend Less Time Diagnosing And More Time Developing YouTube
Question of the week
What are all the ways you can set environment variables?
- App Engine Environment Variables Go, Python, Java, and PHP
- Kubernetes ConfigMap docs
- Kubernetes Secrets user guide
- Storing and Retrieving Instance Metadata docs
Transcript
show full transcriptFRANCESC: Hi, and welcome to Episode Number 35 of the weekly Google Cloud Platform podcast. I am Francesc Campoy, and I'm here with my colleague Mark Mandel. Hey, Mark.
MARK: Hey, Francesc. How are you doing today?
FRANCESC: Doing great. Very excited about our interview with Sharat Shroff and Morgan McLean.
MARK: Yeah, I think it's going to be a really nice continuation of the conversation we had about about Stackdriver with Aja. I think it's going to be a nice extension of that, and people are going to learn a lot.
FRANCESC: Yeah, previous episode, basically we covered how do you know if something's wrong? Today we're going to be talking about how do you know what is wrong?
MARK: Yeah, how do you go about fixing it and working out what's going on there?
FRANCESC: Yep. At the end we are going to be talking about environment variables and 12-factor applications-- 12-factor authentication, that would be pretty awesome. That's really scary-- 12-factor applications and how do you do those on Google Cloud Platform.
MARK: Yeah.
FRANCESC: But before that we have not one cool thing of the week, but two cool things of the week.
MARK: You insisted on putting that second one. You were very insistent about it.
FRANCESC: Yes, because I think it's actually pretty cool. It is a very short thing. But actually, let's leave that for the second one. So let's create some--
MARK: --mystery.
FRANCESC: --mystery, yes. So the first one comes from our colleague Paul [INAUDIBLE]. He's in a rotation. So he's normally a developer advocate, but he's doing it a rotation as an SRE.
MARK: A Site Reliability Engineer.
FRANCESC: Exactly. And it is a pretty amazing thing to do. He's learning a lot. And the best part is that he wrote about it. He wrote a blog post. It's called "Adventures in SRE Land, Welcome to Google Mission Control," which sounds pretty epic. And it is indeed pretty epic. He describes a little bit of what he's been doing for the last couple months and basically why it is so cool.
MARK: It's really cool because he's going to do a series of blog posts sort of outlining and documenting his experiences being a reliability engineer. And I think also we might have him on the podcast at some point soon.
FRANCESC: I think he might have agreed to do that.
MARK: Yes, there may have been some chasing involved. We may have had to lock him down. But we got him.
FRANCESC: Yeah, apparently he's busy doing something, like maintaining the stability of the cloud. No, no, no.
MARK: So not important.
FRANCESC: Yeah, not as important as a podcast, obviously.
MARK: Yep.
FRANCESC: Anyway, so looking forward to have Paul in the pocket, very excited about that. And the second cool thing of the week, it is a pretty short video. It is around five minutes. And our dear friend Miles Ward, head of Solutions for Google Cloud Platform, describes what Google Cloud Platform is and how is it part of Google and why Google has a cloud. And it has a very short video. It is only five minutes.
But if you're curious about it, I think it's a very interesting one. It covers many things, like machine learning and things like that. So just have a look. The link is on the show notes.
MARK: Absolutely. Wonderful.
FRANCESC: Great. So I guess it's time to go talk with our friends Sharat Shroff and Morgan McLean.
MARK: Sounds like fun. So we are joined today by two product managers who work on Google Cloud, Sharat Shroff and Morgan McLean. How are you both doing today?
SHARAT: Doing good, thanks.
MORGAN: Doing great, yeah.
MARK: Wonderful. Wonderful. So the standard question we ask everyone when they come on the podcast is, who are you? What's your History what do you get up to here at Google? Sharat, why don't we start with you.
SHARAT: Sure. I'm Sharat Shroff. I am a product manager working on developer infrastructure on Google Cloud. What that really means is that I'm extremely interested in developer workflows, how developers write code, how they ship code, how do they diagnose their application, how they debug it, and so on. I am right now focused a lot on application-level diagnostics and monitoring.
MARK: Cool. And yourself, Morgan?
MORGAN: Yes, I'm Morgan McLean. I'm also a product manager. I'm on Stackdriver trace. And like Sharat, I have a big interest in software diagnostics. I previously worked on cloud services at other companies. And trace really excites me because it both gives you a view of how your application is running and what services are talking to which other services. And you can also see really interesting details about latency or other unique insights into how your web application works.
FRANCESC: Cool. So recently we had an episode. We talked with our colleague Aja Hammerly, and we discussed Stackdriver as a monitoring tool. But now, when you introduced yourselves, you used this other word, "diagnosis." Could you tell us a little bit about what is diagnosis and how is it different to monitoring?
SHARAT: Got it. So when Aja spoke about Stackdriver, she covered a lot of the system and infrastructure monitoring pieces. And this is basically telling the users, typically in that case ops or dev ops or developer, how their infrastructure is behaving at any given time, at one specified time. What Morgan and I are focused on is basically around when the user knows that they have a problem in their application, how do they go about finding the root cause of the problem? So all the various tools that you need to discover exactly where the problem is occurring and why the problem is occurring, that's where we're really focused on today.
FRANCESC: Cool.
MORGAN: Yeah, I think it would be fair to say that one is more ops-focused. That would be like Stackdriver monitoring and alerting. It tells you when something's wrong, and it tells you from a very high-level perspective what is wrong and what's failing. And the diagnostic tools, like trace and error reporting and debug, can be used to actually find out in your code or in your architecture the root cause of the problem so you can fix it.
SHARAT: And the other way to think of it is these are effectively two sides of the same puzzle. So when you have a problem with your software, you kind of look at it in two different places. Is it a problem in my system, or is the problem in my application? And based on that, you need different tools. You need different tools to find out why and where the problem is occurring. And so much of what we're talking about is at the application level, which is basically around how do you connect the code to what is actually happening in production.
MARK: Cool. So I guess at a high level, what tools are available? Like, say something goes wrong. I'm getting errors in my code. Where does that lead me to within Stackdriver?
SHARAT: So today we have got a few tools that are out there that users can actually use. Logging of codes-- what I consider logging is logging is the one place, it's the one tool that every application developer can use. If they don't have any of the tools available, they can always go to logging, because you can always go back to your code, instrument your code to output something to logs, and then go back and look at logs. You can probably build some kind of an automation to scrape through logs and so on and so forth.
Or even better, the one really cool feature that exists today in Stackdriver is to take the logs, export it to BigQuery, and you then have the full power of BigQuery to analyze your logs. So that is always there.
In addition to logs, we have some tools like trace, and Morgan can tell you a lot about trace. We have error reporting, which basically, if you think of trace as the view of the application from a latency point of view, error reporting is really looking at your application errors, no matter where they're occurring, and be able to analyze your application almost instantly.
And then the fourth tool that you have available is the debugger, Stackdriver debugger, which effectively takes a snapshot of your application at runtime. It doesn't pause the application or anything. It almost at runtime takes a snapshot of your application and allows you to inspect the state of the application as the application is serving out requests.
So those are the tools that you have today. There is more coming online. But this is the four I can talk about right now.
MARK: Excellent. Cool. So I don't know. Maybe let's take a couple of scenarios and kind of talk through them and see what tools we end up. So the classic example, I guess, is I'm getting an error in my application. Where does that go? Maybe does it go to logging? Does it automatically get caught by error reporting? I've written some code in my app, but I don't know where does that information go to, and how can I find it? How I can I know something bad has happened?
SHARAT: Yeah, so errors can manifest in a couple of different ways, right? One sure place where it will manifest is in logs. But error reporting is always scraping through logs. So the moment you have an application, an app engine, there is no setup needed at all, by the way, for any of these tools. There is no additional step of integrating into agents or integrating agents or anything like that. If you have an app engine application, boom, error reporting will work for you. And the moment you have your application and it starts throwing out some kind of errors, Stackdriver error reporting will be able to immediately one, identify that it's a new type of error and alert you that an error has occurred. And three, give you more statistics about that error itself-- how often that error is occurring.
It can give a distribution of that error. Is it happening like 10 times a second or 10 times a week or whatever it is? You have all the statistics available just by going to one URL. So you would get notified. So in this scenario that you described, you would see a notification that tells you that, hey, there's a new error that has occurred. And then you would basically go in and click on that link, and you would then get all the details about that error, including capturing the call stack.
So you will basically associated with that error we capture the entire call stack. Not only do we capture the call stack, we actually parse through the call stack and identify the areas which is most likely of interest. Because we look at the call stack-- whenever I look at a call stack, my eyes kind of glaze over.
MORGAN: Yeah, it's huge.
SHARAT: --because it's huge. It's insane, right? So what error reporting does really well is basically says, OK, great, we have sifted through the call stack. Here are these five lines that you need to really look at. And you have everything that's available if you want to. But it basically hints to the users, saying, these are the five lines that you've got to look at.
MORGAN: And what I found, part of the beauty of Stackdriver and the Stackdriver suite of tools is in situations like this, where maybe there's an error occurring your application. So you find it in error reporting. Or you'd be notified that there's very high latency in your application. You can actually jump between the tools, right?
So an experience for error reporting, I believe, you can launch the debug. In trace, for example, if you find a very high-latency trace, you can launch into the logs for those traces. And so it's not so much a collection of products that you're using or a collection of sort of four different features that Stackdriver offers to you. It's really suite for diagnostics, right? So even once you isolate the problem with one of the lenses in that suite, whether that be logging or error reporting, you can then follow up and get more analysis from some of the other functionality that we offer.
SHARAT: Yeah, I think Morgan brings up a really interesting point here and a really valuable point. If we were going about building tools, we would just keep churning out tools.
MORGAN: Yeah.
SHARAT: But the real thing is we're really focused on developer, dev ops workflows. It's really understanding, OK, and something bad is happening with your application, and you have been notified, or when should we notify you and where you'll be notified. We aspire to hold your hands right from the point where you first get that notification and take you all the way to where the problem is occurring. While at the same time corralling information from the application, from the user themselves, as they're navigating through the journey, and from the system, when we have it, which why we're all under Stackdriver, and where possible, the application's customers, the application's users.
So in App Engine, for example, error reporting can tell you how many customers have been impacted by this specific error. So, yeah, we try to combine all this information in order to help you do two things-- bring you to the root cause and help you prioritize. Like, do I need to drop everything and immediately jump in right now? Or is it something that it can wait and address later?
MORGAN: Yeah, and some cases or even suggestions on how to fix it.
SHARAT: Yeah.
MARK: Cool. So that means, I guess, I could get an error notification through error notifications. That could then make me go look at some logs. Maybe from there as well, I could jump in to either trace or debug. I can sort of jump around as necessary to see where that got things happening.
MORGAN: Yep and there's further integration coming in as we keep building.
FRANCESC: Cool. There's a step that I'm kind of missing on, though, which is so you say that you can jump directly from the error reporting to the code. How is the code linked to your project? Could you talk a little bit about that? How do I do that?
SHARAT: Yeah, so the linkage point occurs typically at the call stack level, where we basically show you file name or the line number. And if the user or if the project has the source code linked to the application, then we can actually do this. And there are a couple of three different sources right now, three different repos that we support.
Of course, it's a Google Cloud repository. So if your code is hosted in Google's Cloud repo, then we are able to, from the call stack, infer the correct version of the application code and basically allow you to navigate directly from the call stack to the application code, and with one click, allow you to take a snapshot. And I'll describe a little bit later about what the snapshot really does.
But in addition to that, if your code resides in GitHub or Bitbucket, then you can link. It's a very straightforward way to link your code that resides in GitHub repo or Bitbucket. But the moment you do that, then the Stackdriver debugger will very easily be able to navigate to the source. That's one of the-- I guess, the magic sauce that exists in all of this.
MARK: So that's that sounds really interesting. Are there any limitations that people should be aware of, maybe by either language or it only works in certain products?
SHARAT: Right now much of what we're talking about works very well for almost all the major languages in App Engine. We are very rapidly building out the same kind of support for our Compute and Container Engine. And in Compute Engine you'll see the matrix, the language support matrix, is not necessarily consistent between trace and debugger and error reporting. But we are in the matter of, let's say, months, I think.
MORGAN: In trace-- weeks, yeah.
SHARAT: Yeah, we will have more and more support.
MARK: We weren't looking down to timelines. I wouldn't want to do that to you. I understand.
MORGAN: Yeah, but certainly in the upcoming quarter and the quarter following, at least for trace-- I can speak specifically for trace. But I believe it's true for the others-- is that support for GCE and GKE is our top priority, because the experience of App Engine is excellent for Stackdriver. And we want to make sure that the experience is excellent on those other compute platforms.
MARK: And just so we're clear too, is that both App Engine Standard and Flexible?
MORGAN: I think that's [INAUDIBLE]
SHARAT: It's App Engine Standard right now.
MARK: OK. Cool. All right, so I'll ask the question, I guess, from the different perspective. Say I'm a developer. I'm working on Google Cloud Platform. Is there anything that I can do to put in place these practices before? Like, as I'm building my application, is there tools or agents or anything that I should be doing sort of from the outset? Maybe for some of those things more like GCE or other stuff?
MORGAN: Yeah, so I know this touches on a previous point. If you're using App Engine, of course, you're getting all this functionality for free, basically, right? Like, the beauty of it is that you don't have to think ahead. You don't have to start linking libraries or go to a third-party solution or anything like that. If you're a developer, however, on GCE or GKE, then you should look for some of the libraries that we offer, right?
So for example, if you just go and spin up a VM on GCE and don't do any additional work, trace won't receive any data from your application. And you'll go to the trace panel on the cloud counsel and you won't see any traces, because we didn't capture any. But if you look at the trace documentation on the Google Cloud Platform website, we have links there to our Java library and a Node.js library for trace. Links for Python and Go should be arriving shortly. And those are libraries that you can integrate with your code. And depending on the library and depending on when you're listening to this, we'll have different levels of support.
But already today, if you're using the Node.js library, for example, you link the library, you get it through NPM in your application, and suddenly you're collecting traces. Some of the other ones, like Java, the initial release, you'll have to sprinkle it throughout your code. And so it's not just linking it. There's a little more work than that. And so that is something you should think about while you're developing. We hope to move beyond that in the future, but that's where we are today.
So, yeah, if you're on GCE, GKE and you're using Java or a language other than Node and you want to use trace and, I think, some of the other features, you should be thinking about this. And you should be thinking about the telemetry that you want to collect, the instrumentation that you want to send us and that we can provide to you, and focus on what's most useful. If trace is very useful to you, then you should go use one of those libraries and sprinkle it in.
SHARAT: Yeah, I think much of what Morgan said applies to debugger and error reporting, except the languages that are left out are different. Debugger [INAUDIBLE] got a few languages-- supports a few languages in GCE. They're all going at their own different paces. But in the matter of months. We'll be at a point where we will have covered all the major languages.
But the other facet of the question that you just asked is are there APIs-- and correct me if I'm wrong. So are there APIs developers can use to leverage the functionality that comes with, say, trace or debugger or error reporting, so that they can incorporate it in their existing workflows or dashboard? And that is already there. So everything from logging, trace, debugger, error reporting, all of these have APIs that's all available through the one platform API.
So if you want to be able to extract traces or write traces-- we'll talk about write as well. But if you want to extract any of this data so that you can host it in your own dashboard, you can do that. And so that's something to think about as well.
MORGAN: Yeah, Or if you want to submit data to those services, but perhaps we haven't provided a library yet, you're certainly welcome to do so through those APIs.
SHARAT: Yeah, I mean, if you think of the example where not everything is traditional request responses, right? So you could have a scenario where a developer is trying to diagnose latency of one specified function that he or she has written down. So you have the ability to say, here's a custom span that I would like to capture. And you insert a start time and an end time. That is not something that is automatically instrumented for you, but a developer can do it. So she or he can basically say, here is a custom start and a custom stop and how this whole thing spanned, represented in the context of my entire request. So they can say, this function adds x-milliseconds to my overall request.
MORGAN: Yeah, and that would be useful even if you were on App Engine. If you're calling like an external service or something you're instrumented otherwise, you can still submit that data through the API.
SHARAT: And you can do all of that using that API that we're talking about, yeah.
FRANCESC: So what you were talking about now made me think about this use case, which is I have one new version of my code. And I want to make sure if it's faster or slower. How could I go to do that?
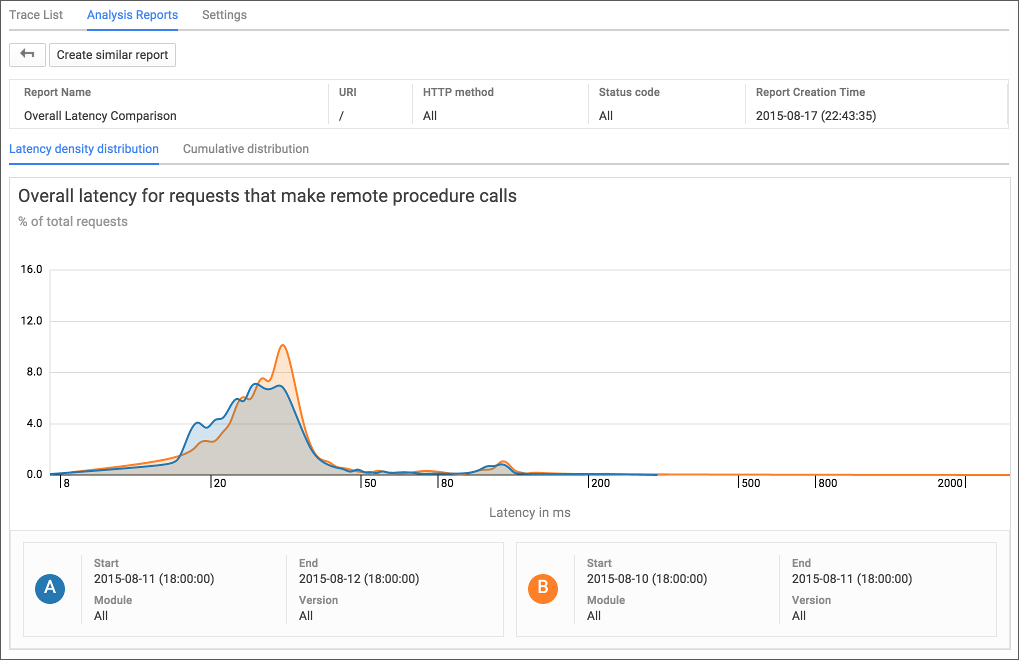
MORGAN: Yeah, so I think you'd probably want to start in trace, because this is primarily a latency analysis. And trace actually has some pretty unique features that allow you to do this. So in the past, of if you're using other tools, what you might do is take a collection of traces before and after of the different versions and do a manual comparison and probably eyeball it and see if the latency has changed.
But trace has a feature called Analysis Reports that will do this for you both automatically, or you can create custom ones. So every day, if you're submitting data for trace, whether that's because you have an App Engine application or you're submitting it through one of our libraries or through the trace API, every day we go and do comparisons day by day and version by version of the latency of your application. So let's say you rolled out a new version and you didn't take any additional actions, next time you go to the cloud console, you'll see that there's actually a comparison in that section of the trace UI that did a comparison day by day. And if that latency has significantly changed, either for better or for worse, but if the profile of latency has changed, we will both alert you and give you sample traces that let you do that comparison for yourself.
Secondly, if you want to do a manual report, which you can do immediately, right? So you don't have to wait for the next automated one to come through. You can trigger a manual report to do either a version-by-version comparison or a time comparison. Let's say you could compare yesterday's traces to all the traces collected over the last month on average. And it will run that same analysis report for you and tell you if there's been a significant change in the profile of latency for your application or for a particular component of your application.
Or you could do it per endpoint or something like that if you have microservices architecture. And it'll also, once again, give you the sample traces so you can actually get examples and maybe click through on a few and go, oh, maybe the database or something slowed down after we rolled a version forward or calls to this service slowdown. And so you can actually very rapidly isolate what changed and then you can use that to jump in other tools like, debug, to find out specifically why it changed.
SHARAT: And error reporting as well is version-aware. So the moment you push out a new version and a new kind of error or a new error starts occurring, it's automatically captured. And you always have the ability to right there on the top--
MORGAN: You can filter.
SHARAT: You can filter down by version. So you can say, here is version A, version B. But it's good to also highlight at this point the underlying emphasis on trying to remove some of the operational friction, where we would prefer, we would like to remove some of this what I would call grunt work so that developers can focus all their effort on creating while Google's got their back, right?
Basically, when a new version rolls out, we'll be aware of it. And not only will we be aware of it, we'll always compare it with what's happening with a previous version. And if we see significant amount of divergence in any of these, whether it's latency or availability or errors, we'll immediately service that app. We'll always be able to take link those errors to the right version of your code so that we can allow you to kind of very quickly navigate through to the problem.
FRANCESC: Great. Well, we're kind of running out of time. But what could you recommend for our listeners if they have never tried any of the Stackdriver features? What is the first thing they should do?
MORGAN: Well, if you're on App Engine, you should just go use it. We have a pretty good adoption on App Engine. But like there's no reason to not use Stackdriver on App Engine because you get all these tools for free. We're already collecting instrumentation data. If you have a large, important set of applications on App Engine, you should go try out the Stackdriver suite immediately. And I think you'll find that it's really useful.
FRANCESC: Great.
SHARAT: Yeah, the other thing I would emphasize is it's as simple as clicking through to a tab on the cloud console. And you'll be able to see it's all under the Operations tab group. And you'll just be able to click on it and everything should be working. And once you do that, everything else is just turned on automatically for App Engine Standard. And we will continue to have that same level of focus towards minimal amount of setup needed so that users can use that when we have the same offerings available in compute and containers and everywhere else.
MARK: So, yes, we are running out of time just a little bit. But is there anything else you'd like to add that we haven't either covered or maybe haven't mentioned, or something you'd like to plug about Stackdriver or Stackdriver diagnostic stuff?
SHARAT: Yeah, so the one thing that I want to emphasize is all the features that you hear about in diagnostics, whether it's logging or trace debug, error reporting, all of these features that we enable completely automatically out of the box, we are obsessive about performance of the overall application itself. What I mean by that is the footprint that we use in order to do this, the amount of overhead that is added to these applications in order to capture all this diagnostics--
MORGAN: It's very low.
SHARAT: --is in the order of microseconds, or single-digit millisecond is the way to think of it. So we want to make sure that we are not adding an additional burden to the application itself. The second thing is we basically-- every one of these things that we capture, every one of those pieces of information that we capture is basically curated. It is basically analyzed by some of our algorithm here.
One example to think of is trace [? insights ?], right? We have about a billion traces or more than a billion traces, easily more than a billion traces coming into our system every day. Each one of these traces is analyzed for points-- to identify points of sub-optimality within them so that we can actually say, hey, you're making too many data [INAUDIBLE].
MORGAN: Or your mem cache calls are very slow.
SHARAT: --or mem cache calls or something like that. So we identify every single trace so that we can then provide [INAUDIBLE] all of that information to the developer.
The third thing to call out is if you want to basically go from identifying a problem or identifying the location of a problem to the root cause, there isn't a better tool than debugger. The way to think of the debugger is it basically-- I think one of the engineers who wrote this tool describes it really well. It's like taking an x-ray of a person who is running without stopping the person, right?
You can see the internals of the entire system. I've got some of the best stories around very interesting bugs that debugger has uncovered, just by the ability to have a very detailed view into the working of the application without ever pausing this application.
MORGAN: It's like a snapshot in production.
SHARAT: It's a snapshot. And to reproduce similar functionality, it often takes developers days. One way to think of it is very often, if you're in debug and trying to find the root cause of a problem, you would go instruments on lines of code. You would, again, go through the validation and deploy it. Again, go back and analyze the code. Again, do this thing multiple times until you've probably found the right thing. With debugger, wherever the problem is occurring, even if it's happening in production, no problem. Just click, Take a snapshot. Boom-- you'll very quickly be able to say, ah, there is a risk condition that I didn't see.
You don't have to reproduce that anywhere in a test environment.
MORGAN: You have to redeploy.
SHARAT: You don't have to debug in production, right? And that just is spectacular. When customers use it, and I hear the wow, it's very exciting for us building these tools.
MORGAN: And correct me if I'm wrong, I think that actually works across App Engine and GCE and GKE, right?
SHARAT: Yeah, many GCE languages already support it. And so many of this is available in GCE and GKE as well.
MARK: Awesome. Well, yeah, like I said, I think we are running out of time. So I think we're going to have to cut it there. But thank you very, very much to both of you for joining us. We really appreciate it.
MORGAN: You're very welcome. Thank you for having us.
FRANCESC: Thank you.
SHARAT: Thank you, folks.
FRANCESC: Thanks again to Sharat Shroff and Morgan McLean for sharing their very deep knowledge on Stackdriver and especially on the diagnostics part of it. I discovered many different tools that I'm going to be using next time I have an issue. I'm not looking forward to having any issues. But for time, I know what to do.
MARK: Yeah, no, I actually kind of wanted to sit down with debugger now and just kind of just poke at my app and just see what it's doing, like just at a given point in time.
FRANCESC: I had some fun with the debugger. And I've got say, it's pretty impressive. Basically, instead of just adding more and more logs, which is normally why I do it, because that's how I do it, rather than just logging every single value in your function, you just put a little breakpoint. And you don't actually stop it, so it is awesome.
MARK: Perfect.
FRANCESC: So let's go with the question of the week.
MARK: Yeah, you posed a really interesting one when we were sitting here earlier.
FRANCESC: Yeah, so the question of the week is, OK, so I've been reading about 12-factor-- not authentication again-- 12-factor applications?
MARK: Yep.
FRANCESC: And, by the way, if you don't know what they are, you should just search that on Google and read a bit about it.
MARK: We'll put it in the show notes.
FRANCESC: Yeah one of the things that the 12-factor application manifesto says is that you should always deploy basically the same artifact everywhere, so the same compile binary or the same Docker image or whatever you're doing. And the differences between QA and test and production should be done with environment variables. So the question is, how do you do that? How do you do environment variables on Google Cloud Platform?
MARK: Yeah. And there's a few different ways that you can do it, depending on which product you're on.
FRANCESC: Yeah, basically, so depending if you have GCE, GAE, and TKE-- so if you have--
MARK: Say that three times quickly.
FRANCESC: No, I cannot do that. I'm surprised I did it once. So on App Engine there is actually I think call environment variables. So you can set them very easily inside of the app.yaml or app.xml, depending on the language you're using. And basically, it allows you to say, hey, the variable name-- I don't know. Not host, that's a bad idea. But like, let's go with database URL equals something. And then when you access it from your App Engine code, it actually looks like it's an environment variable. So every language has different ways of accessing those. But basically it will behave like any other environment variable.
So what about on GKE, on Container Engine?
MARK: So GKE you have a few options. Quite similarly to App Engine, when you're sending your YAML files or your configuration up to your Docker containers or update GKE itself up to Kubernetes, you can explicitly set environment variables in that YAML file. But if you want something that's maybe a little bit less coupled, a little bit more flexible, you can do things like config maps or secrets. Those are ways to send up information up to Kubernetes with a given name that can then be looked up later.
Those can be exposed in a variety of ways, from like volumes and a variety of other things. But one of the ways you can do that is sending up data as environment variables. Secrets tend to be used when you've got like private information, like usernames and passwords. Config maps are used when you have tech stuff, like maybe where is my database pointed at, or maybe where is the URL for my mailing list? Or maybe it's just like, hey, this is the version of this app that I want to display. It's got a blue button rather than a red one-- less sensitive stuff. So you have a variety of options there.
Now on Compute Engine, so if I'm running just a straight up VM, is there an option that I can use there?
FRANCESC: So one of the things that you can imagine is you log into your instance and you just set the environment variable there-- whatever OS you're running. So let's say you're using Linux, you go export whatever equals whatever. And that will work. But the next time you start a new instance, it will not have those values. So how do you do it if you want to set those environment variables across all your instances?
Well, the best way is actually using the metadata server, metadata server API. And it is just a key value store. So it is very simple. And whenever you're going to set a new one, all the instances that are already running will have access automatically to that value. So it can be very useful for if you're doing something like the database, like a link to the database. And if at any point you need to change that, you just change it. And if your code is regularly checking that variable out, everything will just work.
It is also completely safe, so you can store secrets if you want to. It is encrypted, so there's no problem with that.
And finally, the cool thing is that this will actually work anywhere. So you can access those variables from Compute Engine obviously, but also from a App Engine and Container Engine.
MARK: Now, do I need to like call an API to do that, or is that just inherently available?
FRANCESC: So if you're in App Engine, you need to use an API. It is very simple. It's a rest API. And I'm almost sure there's a library for that.
MARK: Yep.
FRANCESC: But even if there was not, it's just basically a get. It's a get requests onto a URL that is only accessible from inside Google Cloud Platform, so only you have access.
MARK: I can do exactly the same thing from a Docker container inside GKE as well.
FRANCESC: Exactly.
MARK: Perfect.
FRANCESC: Yeah, it is very simple, but it is incredibly powerful, and you can use it from anywhere in your projects. So it makes it for very easy way to integrate different pieces of your architecture.
MARK: That's cool. So if I wanted to share, say, some information across an App Engine and GKE and maybe GCE project that I wanted to stay the same across all of them, that could be my central location for [INAUDIBLE].
FRANCESC: [INAUDIBLE] server API. It's going to be the best place, yes.
MARK: Very nice. Excellent. OK, well, Francesc, are you going to be anywhere fun and interesting in the next coming weeks? I know you're relaxing now that GopherCon is over.
FRANCESC: Yes. GopherCon is over. The videos will be up sometime soon. And in the meanwhile, I'm going to be chilling on the beach soon. But don't worry. We're going to be having episodes nonstop.
MARK: There's no break.
FRANCESC: There's no break. I'll be just somewhere enjoying the beach. But in the meanwhile, yeah, I don't have any interesting plans to share, which is awesome. I think that your case is a little bit different.
MARK: Yeah, so I had some things that are cooking in the fire for a while, and they've come to fruition. So when this comes out, the week after that, I will be in Israel. And I'm doing multiple events in Israel. So I am going to the GDG Cloud Tel Aviv meet up. I'll be here on the 25th. The day after that I will be at JavaScript Israel on the 26th that evening. And the main event I'm coming up for is [INAUDIBLE]. They have a development day talking about game development, going to be showing some Firebase content off of there.
So I'm going to be running all over the place in Israel.
FRANCESC: Nice.
MARK: Nice. After that, I'm taking a bit of a vacation. But like I said, we've got podcast episodes.
FRANCESC: Very well-deserved vacations. Great. Well, thank you so much. Have a good trip.
MARK: Thank you.
FRANCESC: And see you all next week.
MARK: See you all next week.
Hosts
Francesc Campoy Flores and Mark Mandel
Continue the conversation
Leave us a comment on Reddit